Hell’s Kitchen was once home to working-class Irish immigrants who fled the potato famine and worked on the docks and in the railyards built along the West Side. During Prohibition, the neighborhood warehouses were ideal spots for storing smuggled alcohol, leading to organized crime. By the 1970s, the neighborhood entered a steep decline as container ships reduced the need for longshoremen and the Port of Newark became more dominant than the Hudson River’s piers. This decline was a catalyst for the first wave of gentrification, leading to projects like the Javits Center, and then later projects like Hudson Yards and the 7 train extension. Today, the neighborhood is a thriving destination in the heart of the city, a short walk from the southern end of Central Park, Broadway and the theater district, and transportation hubs linking the people around and out of the city.
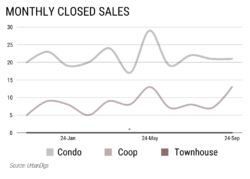
This past month saw an upswing of coop closings from the summer, with 13 units closing. That’s up 18% from last year. Condo sales have remained relatively steady over the summer and into last month with 21 closings. Overall, that’s an increase of 10.5% since the start of the year, but still down 16% since last year. Townhouses are hard to come by in Hell’s Kitchen, and that probably explains why none closed last month, or at all this year.
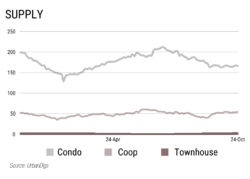
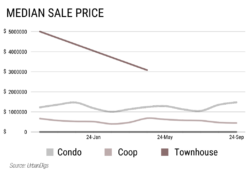
There are just 3 townhouses listed in the whole neighborhood, and the good news for buyers is that those represent 200% more available stock than last year. Unfortunately, with so few townhouses on the market, there’s little information on the changing price per square foot or median sales price.
It’s a bit easier to find an apartment in Hell’s Kitchen, though. There are 166 condos for sale and 54 coops, but the overall supply has been relatively steady over the last two months. There are 16.6% fewer condos available since last year and 12.9% fewer coops.
When it comes to median sale price, condos and coops are headed in different directions. The average condo hit $1,475,000, up 9.3% from last month. Those prices are trending up too, 24.5% since the start of this year, and 21.9% since last year. Coops are a different story. The median sale price is lower at $446,250, a price point that has been trending down. Since last month, the average coop is down 5.8% and 30.4% lower than this time last year. However, there are fewer overall coop sales than condos and just a few sales in either direction can have a big impact on averages.
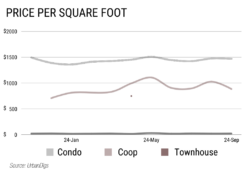
The median sale price discrepancy can perhaps be better understood by the price per square foot. Condos saw a year to date increase of 8.1% while coops saw a 9% increase since the start of the year. For coops, an increasing price per square foot alongside declining median prices would suggest coops are seeing sales of smaller units – the type of apartment that commands more per square foot, but has an overall lower price tag. Overall coop prices per square foot are down 6.7% since a year ago. Condo square footage is relatively unchanged from last month, down .5%, although this price is up 2.4% from last year.
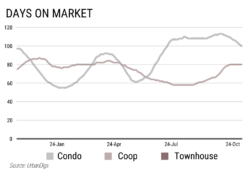
When it comes to the number of days the inventory has spent on the market, it’s been a bit of a roller coaster. Over the summer, coops were on the market less than two months, but that’s climbed 14.4% since last month to an 80-day average. Condos have seen even larger swings. Earlier in the spring, inventory was sitting for about three months on average, dipping quickly to around 60 days in May and then climbing back up over the summer to over 110 days on the market. That’s fallen 11.5% since last month, and condos are on the market about 100 days now and trending downward. Total days on the market is still up 78% since the start of the year, but unchanged year to date indicating older inventory may clear out through December to make way for new listings coming in the new year.


